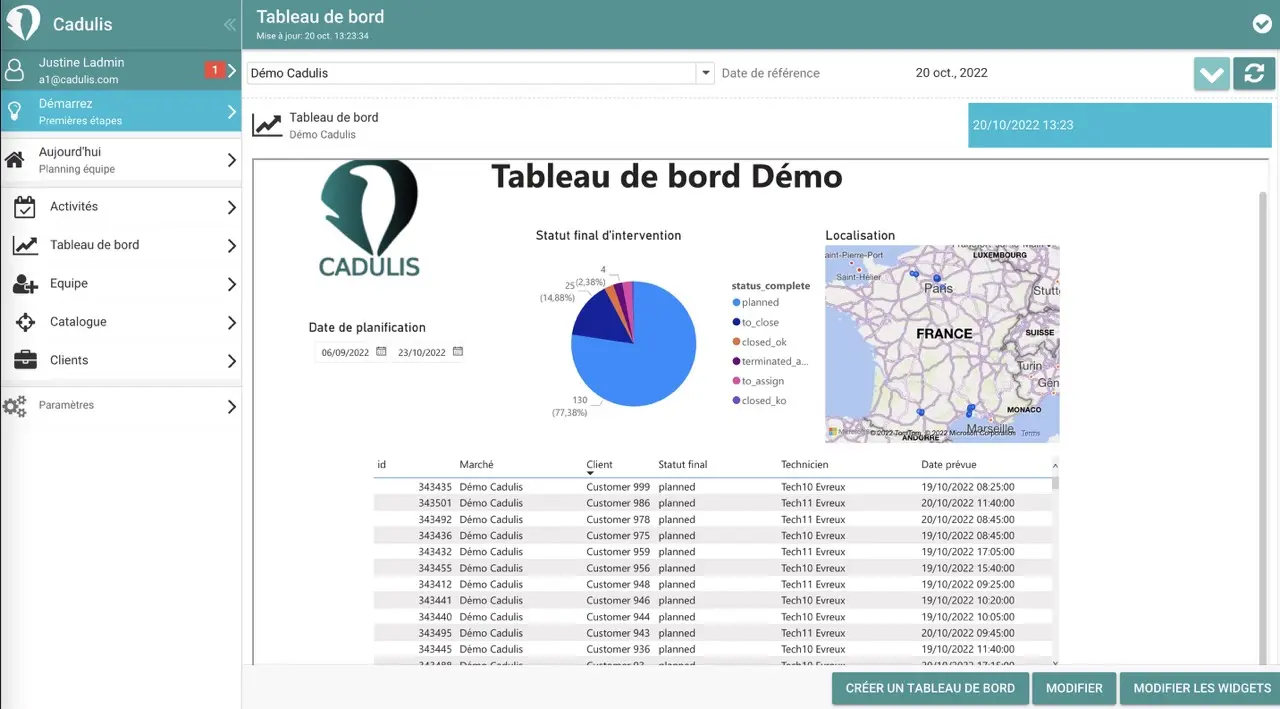
Cadulis data visualization in PowerBI
PowerBI is Microsoft’s data analytics solution for handling large volumes of data.

Advantages
Available Features
If you feel limited by Excel, PowerBI will likely allow you to take your data analysis much further.
Large Volumes
PowerBI can load, albeit with some time, very large volumes of data: several hundred thousand, or even millions, of activities, represented as graphs.
Sharing
Through publishing on the Microsoft cloud (requires a license costing around ten euros per month), you can share your visualization with anyone you want.
You can also display your dashboard directly in Cadulis
A mobile app provided by Microsoft is also available: you can directly view your graphs on iOS or Android.
PowerBI Desktop
Download PowerBI desktop https://powerbi.microsoft.com/
Just like Excel, you need to install the software to create your dashboards.
Dashboard
Create a new dashboard.
In it, click on Transform Data. This will open PowerQuery and allow us to configure the data source.


