The Cadulis application, documentation, and email support are nevertheless available in your language. You can create your account for free in 1 minute!
Analyze your field service data in real time
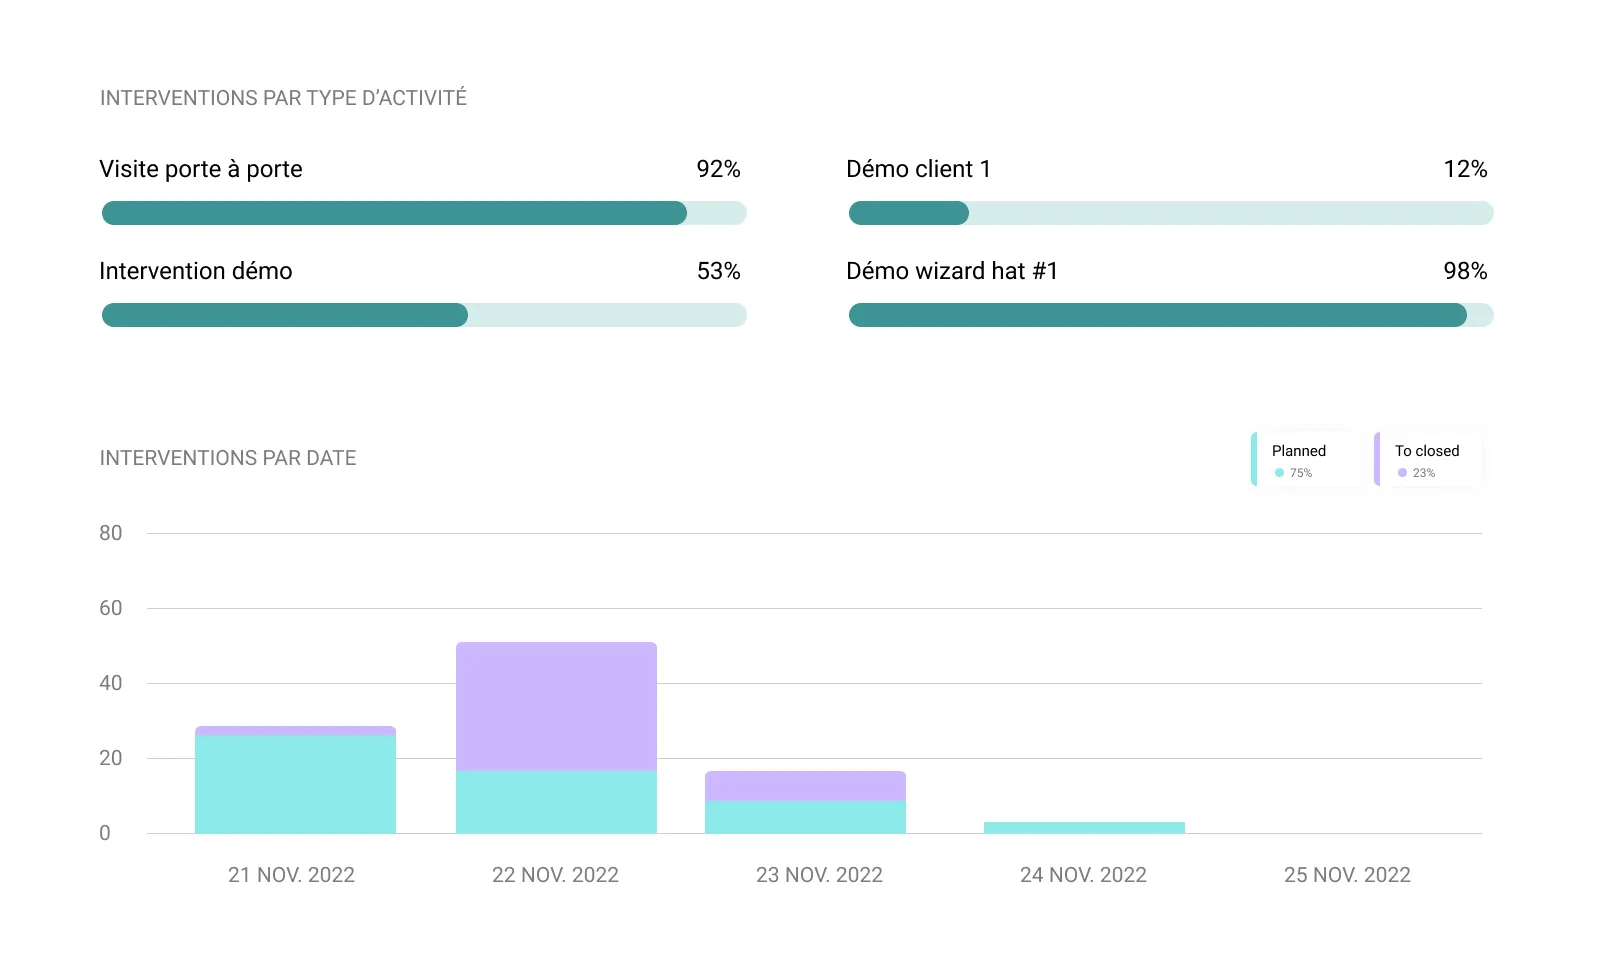
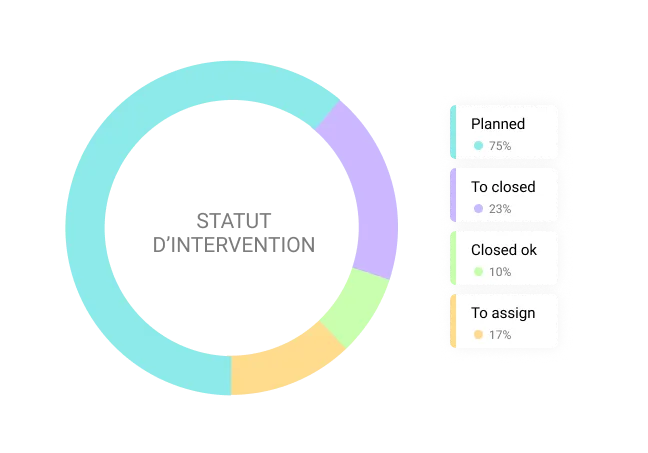
Monitor your key metrics in real time: intervention time, productivity per agent, profitability per site, report completion.
Create custom dashboards or export your data in PDF, Excel, Word for in-depth analysis.
Leverage all your data, including custom fields, to create dashboards tailored to your business needs.
Connect Cadulis to your favorite analytics tools: Excel, Power BI or Looker Studio, for optimal data visualization.
Benefit from real-time updates of your data, without waiting for nightly exports. View and export in just a few clicks.
Field service analysis in one click


Focus on your schedule management indicators
Discover other features.
Cadulis offers complete field service management:
from the first contact * to the last click to exploit your results!
Schedule
Find the right field worker automatically.
View all your routes at a glance and let AI save you hours.
Intervene
Your teams access their personalized forms even offline. Photos, signatures, comments, intervention reports: everything is ready, nothing is forgotten.
Connect
Synchronize your systems and teams with our integrations: API, emails, SMS, accounting, business connectors…
No more double entries. Welcome to seamless workflows.
Analyze
Keep an eye on your management indicators without waiting for the end of the month. Dashboards, custom reports and profitability: make better decisions, faster.
Ensure your success with Cadulis.


A 30-minute video call to understand everything!