LookerStudio - Data source
Sign in to Google Looker Studio (Looker Studio): https://datastudio.google.com/
Cadulis Predefined Data Source
2-Click Creation from Cadulis Export
From the configuration page
of your data export on Cadulis, you can directly click on Create a DataStudio/LookerStudio data source
This link will take you straight to the LookerStudio data source creation page, already filled in with your Cadulis download code.
Google Warning
If you used this method, you can skip directly to report creation
Manual Creation with the Code
Click on Cadulis activities data source
Enter your Cadulis code, obtained from the export configuration page.
To create a data source for tracking your Cadulis licenses: Cadulis licenses data source
Move on to report creation: your data source is now configured!
Data Source
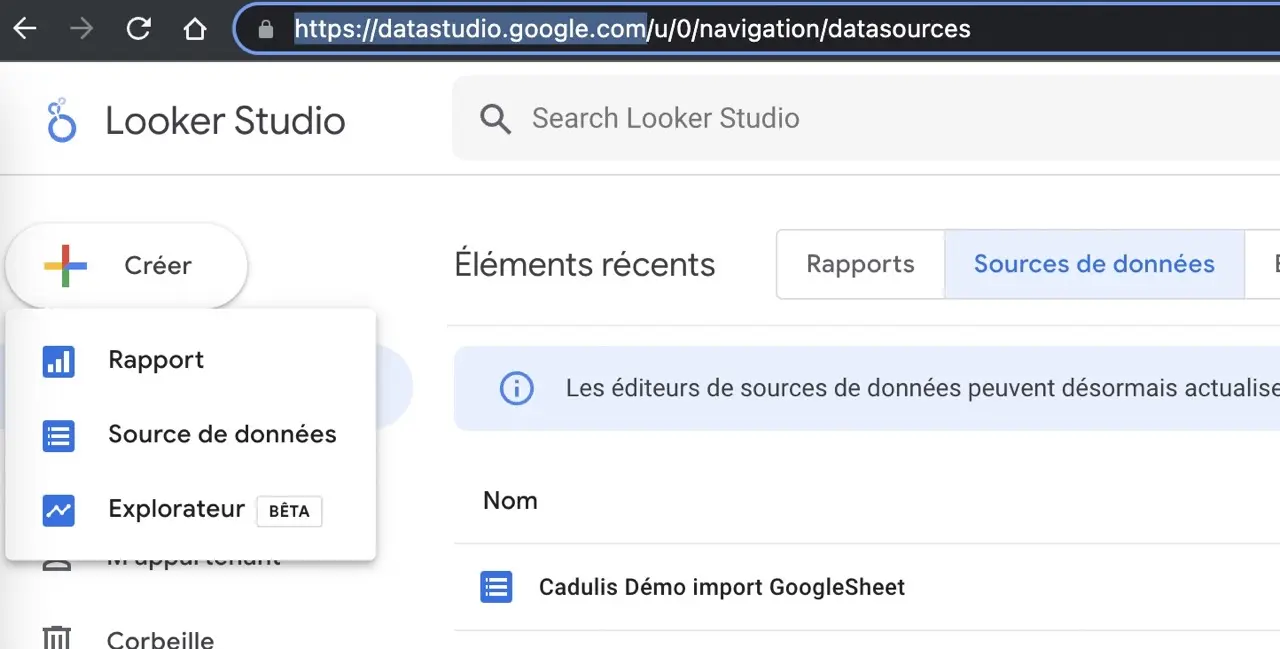
Log in to your previously configured Cadulis data source: click on Create, then Data Source

You now need to select the connector
Cadulis
Search for Cadulis and select the partner connector provided by “Cadulis SAS” Cadulis activities.
You can also use the link Cadulis activities data source
Enter your connection code (previously obtained from the export configuration on Cadulis) and confirm.
Remember to rename your data source so you can find it more easily!
Google Sheet
If you have set up the source as a Google Sheet, choose the Google Sheet connector
Select your Sheet file, as well as the sheet where you imported your data
At the top of the page, change the data source title: it will be easier to find later!
Click on Connect
Large Volume Ingestion
This method is not efficient for ingesting large volumes of data:
If you have more than a few thousand rows, you will probably need to use a faster or even sequenced ingestion method. Below is ingestion via bucket, but you could also use BigQuery or another big data engine ;)
Google Cloud Storage
If you have set up the .csv export to a Google bucket, choose Google Cloud Storage
Select your file from the bucket
At the top of the page, change the data source title: it will be easier to find later!
Click on Connect
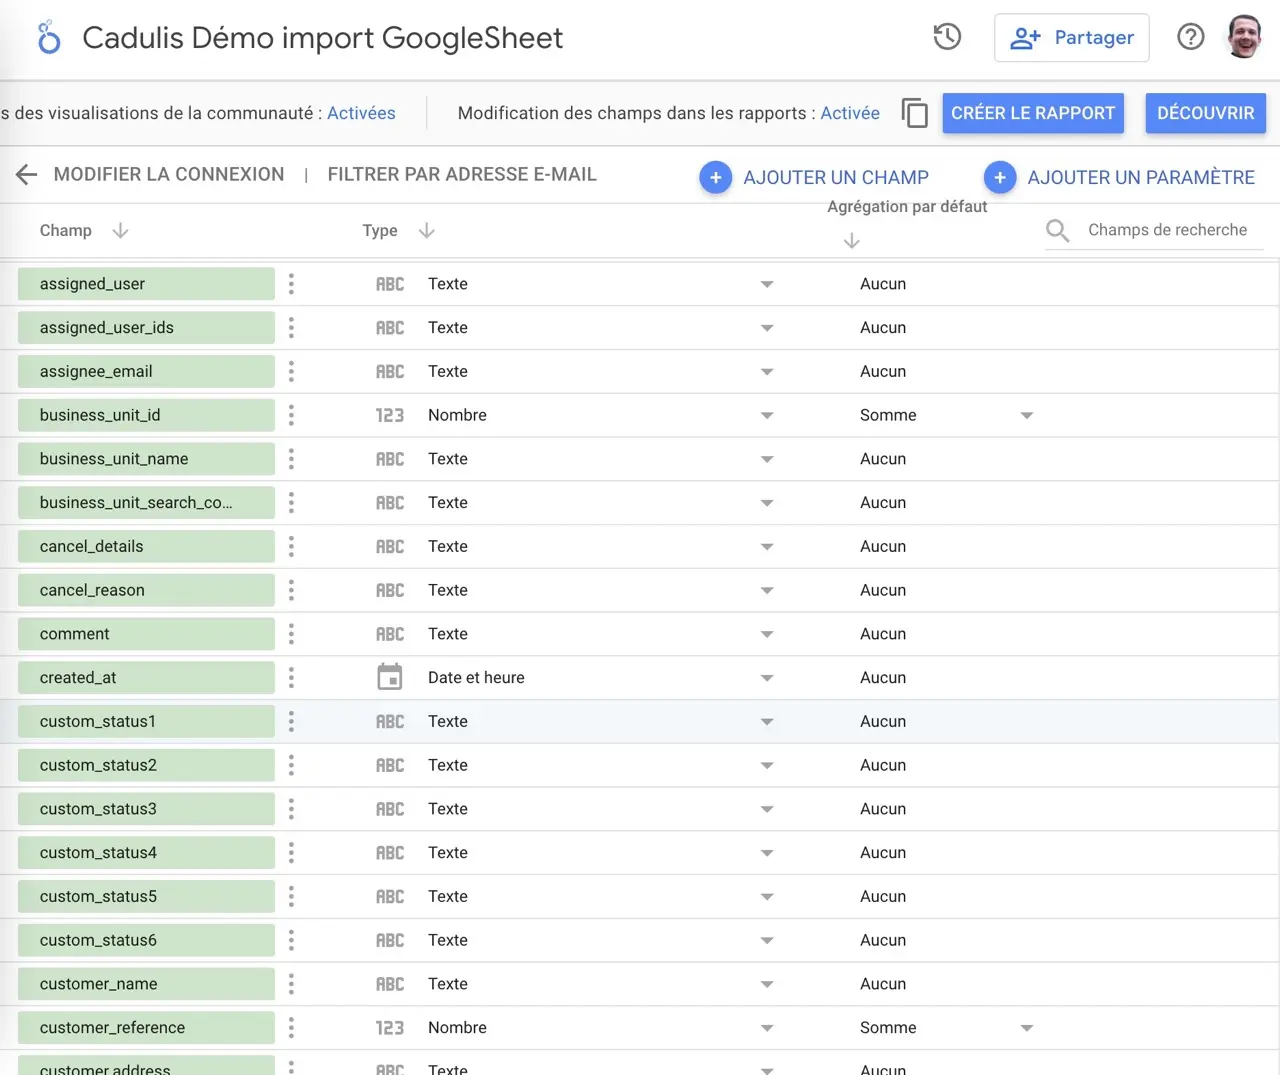
Imported Fields
On this page, you can refine the data type for each field.

On this page you can pre-calculate fields, such as a
lat_lonfield, required for map visualization
Don’t worry: you can always come back later to modify field types.
Your data source is configured!
You can always come back to modify it: refresh frequency, field types, etc.
Click on Create Report
Bonus: lat_lon Field Calculation
For the next step in this example, we want to display a map with the positions of interventions.
DataStudio requires a lat_lon type field, but Cadulis only exposes latitude and longitude separately.
- Click on
Add a field - Field name: enter
lat_lon - In formula, write the following formula and save
CONCAT(location.latitude,",",location.longitude)
- Finally, you need to change the field’s data type, select
Geographic Data>Latitude,Longitude


